Blog | nearby computing
Full-Stack Observability: Redefining the way we predict, prevent and diagnose systems
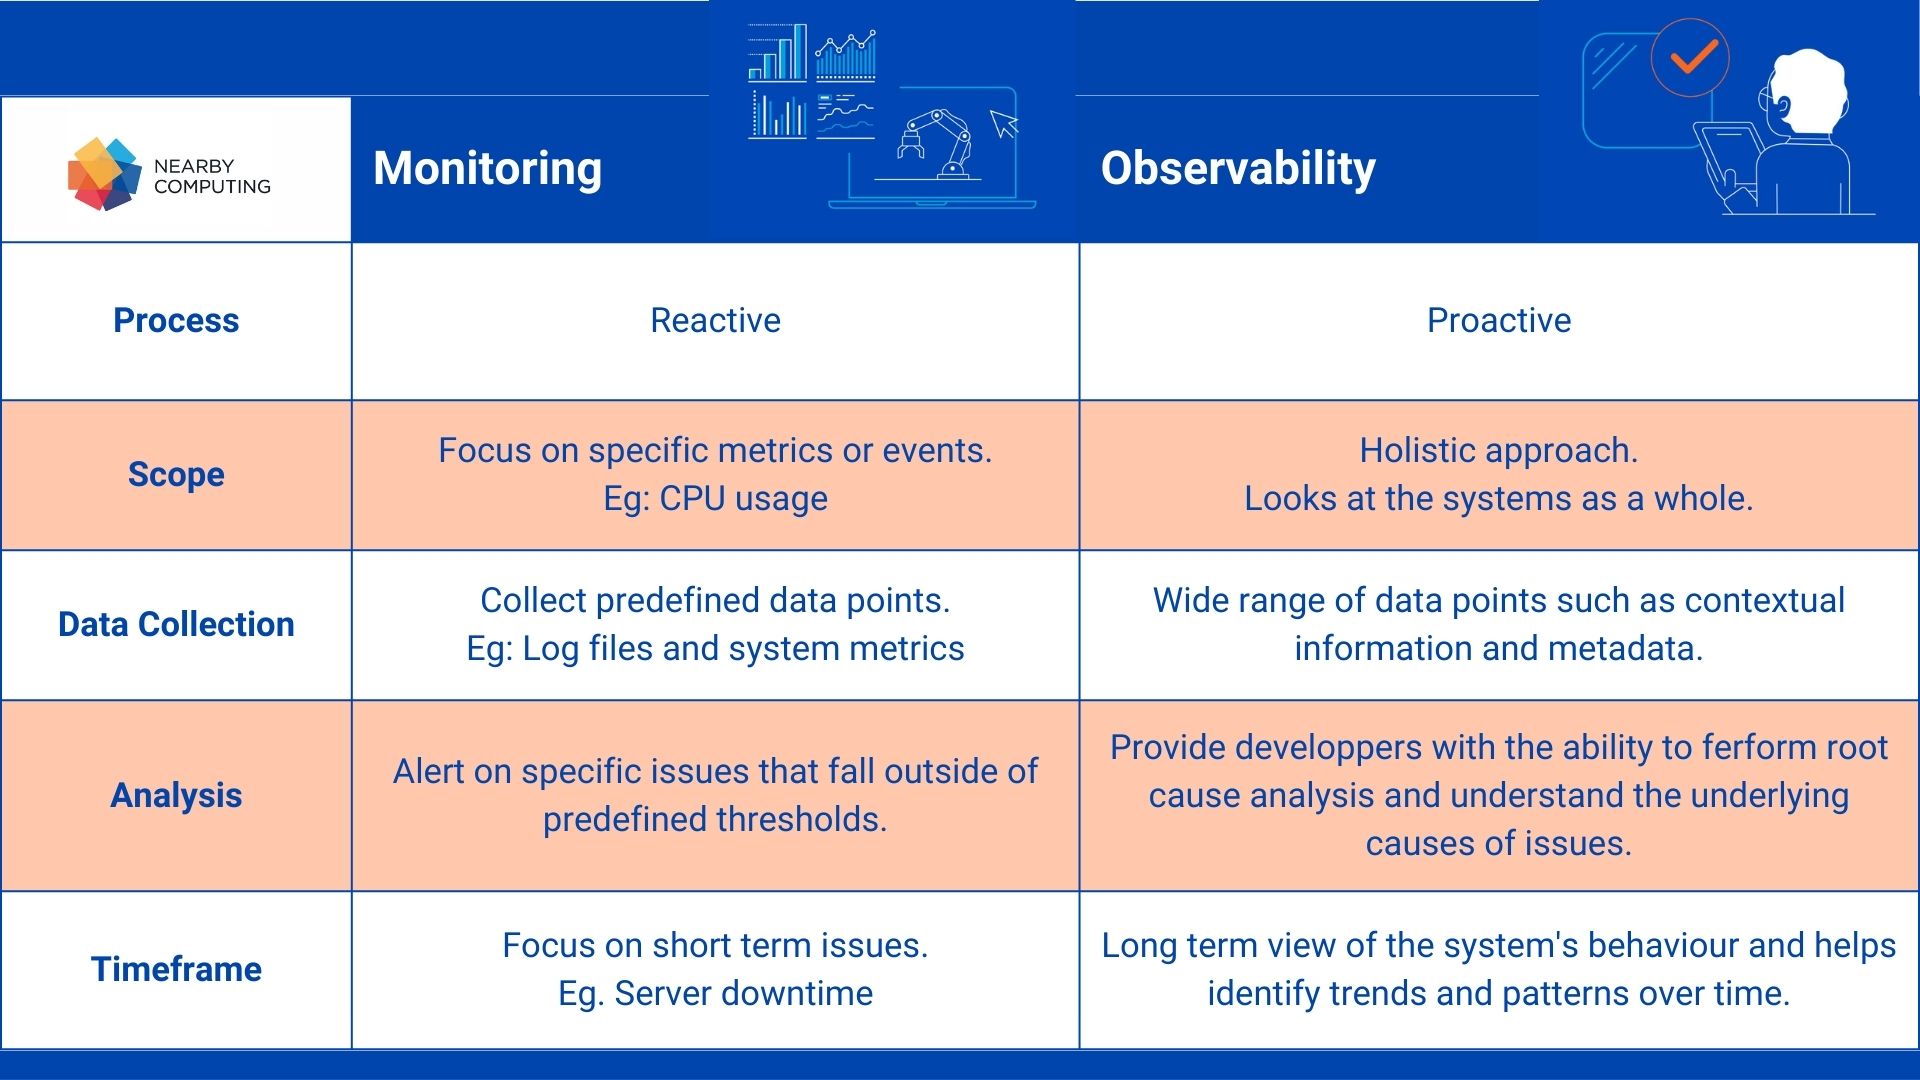
Full-stack observability is the ability to understand how a system operates. Monitoring and observability are two terms that are often used interchangeably but have different meanings. While monitoring is reactive and involves collecting data to check against pre-defined thresholds, observability is proactive and involves understanding how a system is behaving and why it is behaving that way.
Observability is essential in edge computing because it helps developers and operators gain insight into complex distributed systems. It enables them to diagnose problems and make informed decisions to optimise performance and reliability. Full-stack observability refers to the ability to understand the internal state or condition of complex systems by analysing only their external outputs. The level of observability directly affects the speed and accuracy with which the root cause of a performance problem can be identified without the need for additional testing or coding. A system with higher observability can be managed more efficiently and effectively.
In the context of orchestration and automation, observability is critical to provide insights into the orchestration engine so that automation control loops can be properly enforce, guided by KPIs extracted through the observability stack. NearbyOne is enabled with the possibility to connect to observability stacks and to define management policies associated to the operated elements, including services, network functions, applications and infrastructure.
Four essential pillars of observability
To achieve full-stack observability, there are four essential elements to consider: metrics, logs, traces and dependencies. These elements provide insight into the behaviour of a software system and help to identify problems.
Metrics: Metrics describe the overall picture of a software system and provide insight into the behaviour of the system. Examples of metrics include CPU usage, memory usage, network traffic and error rates. These metrics could be SLIs (Service Level Indicators), which help organisations to measure some aspect of the level of service provided to their customers. SLIs are part of Service Level Agreements (SLAs) that affect overall service reliability. SLIs can help organisations identify ongoing network and application problems, leading to more efficient problem resolution.
Logs: These are records of events that have occurred within the system. These events can be anything that is considered important by the business or the software. They can be used to understand the sequence of events leading up to a problem and to diagnose the root cause of problems: when an error occurs, the logs show when it occurred and what events correlate with it.
Traces: These are records of individual requests as they move through the system. They track end-to-end behaviour and can be used to understand system performance and identify bottlenecks and other problems. Traces typically include when a request started, when it finished, some context, and any previous traces that led to the current trace.
Dependencies: These are alerts that are triggered when certain thresholds or conditions are met. They allow operators to respond to problems in a timely manner and minimise the impact of outages and other issues.
Observability, monitoring and telemetry
Modern software systems are complex and can experience failures, degradations, bugs or even disasters. Traditional monitoring is limited to identifying problems in one part of the system, making it difficult to track problems across a distributed system. Full-stack observability, on the other hand, collects data from all parts of the system to provide a unified view of the software as a whole.
Telemetry data in modern software systems is critical for identifying and resolving bottlenecks, bugs and errors. Understanding observability practices provides insight into the performance of a software system. By collecting and analysing telemetry data, developers can improve the efficiency and reliability of their software system.
While full-stack observability is concerned with understanding the internal state of a system, monitoring is concerned with ensuring that a system is working correctly. Telemetry, on the other hand, is the automated collection and transmission of data from remote sources.
The observability stack is deployed as a service on top of NearbyOne. Therefore, it must be adapted to the specific needs of each deployment. It consists of standard observability components that are commonly used across multiple domains to collect and aggregate telemetry, logs and traces.


